|
|
Bachelor's Degree in Telecommunications Systems and in Network Engineering |
|
|
Arduino-based temperature meter |
Signal acquisition, temperature measurement, FSM, Arduino
1. Specifications
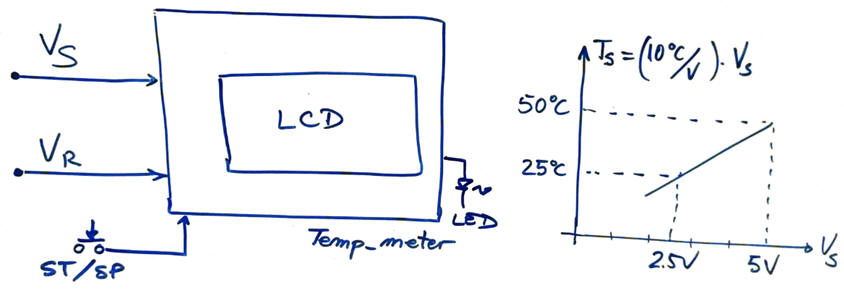
Design a temperature meter to display in an LCD two temperatures TS and TR.
- Temperature range from 20°C to 50°C. Analogue input sensitivity is adjusted to VS (or VR ) = (0.1V/°C)·TS(°C).
- Temperature resolution 0.1°C.
- Sampling frequency is 2 Hz.
- Pushbutton to start and stop acquisition and a LED indicator switching ON and OFF at sampling ratio.
- LCD with I2C interface.
- FSM software organisation.
- Arduino board.
- Sensor conditioning circuits are powered from Arduino VIN input using a voltage regulator VREG = 10.0 V. Design an example circuit for conditioning an LM35 sensor and a reference potentiometer.
- Program an Arduino board and design a shield to solder all the components and connectors.
 |
|
Fig. 1. Symbol of the temperature meter circuit and calibration curve for temperature representation. |
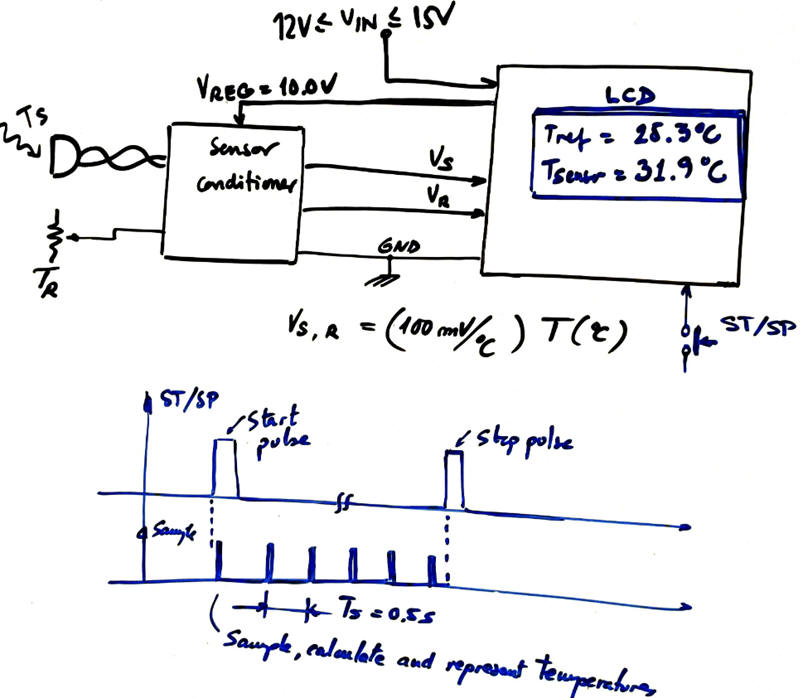
Fig. 2 shows how the temperature meter can be used to power sensors and signal conditioning circuits.
 |
|
Fig. 2. Block diagram of the temperature meter. The device remains idle when powered. Clicking ST button the device starts measuring and representing temperatures at the sampling frequency until the same button is clicked another time (Stop). |
2. Planning
A) Planning hardware
Step 1: Hardware. Sensor signal conditioner. Temperature reference circuit using a potentiometer.
 |
|
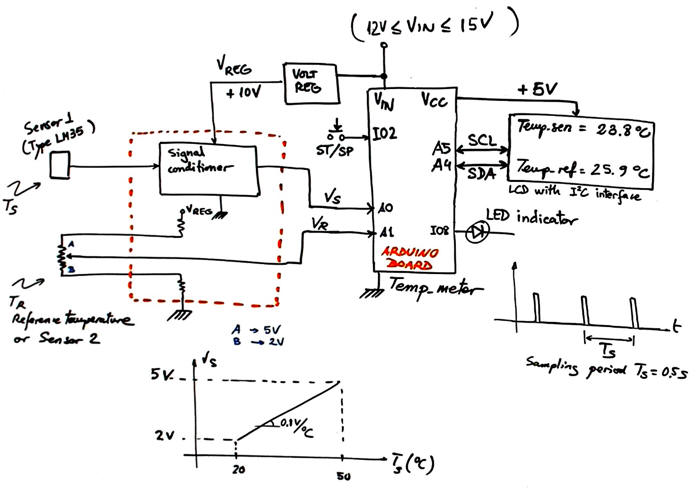
Fig. 3. Block diagram of the temperature meter. |
Arduino board is used as data processor and LCD adapter.
 |
|
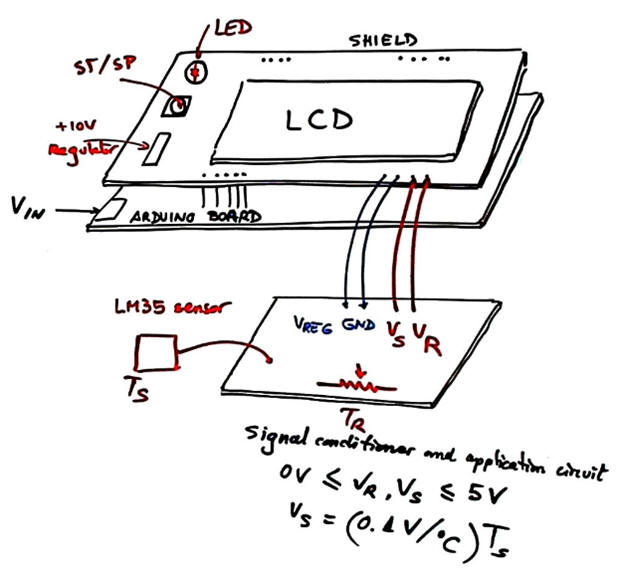
Fig. 4. Proposed Arduino shield and auxiliary prototype board where the sensor and the reference potentiometer are attached. |
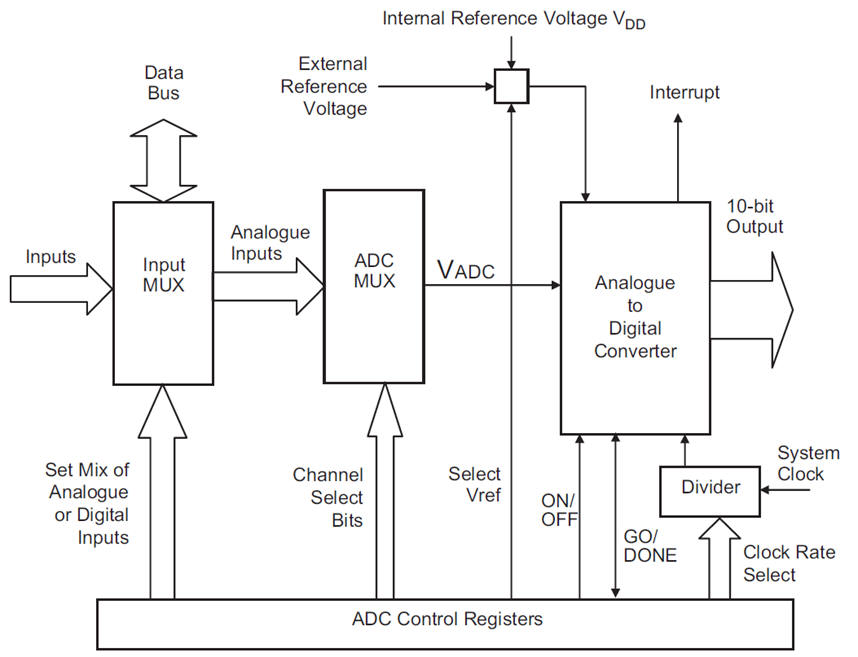
The key device for analogue signal acquisition is the A/D converter. Fig. 5 represents a typical A/D peripheral. Several analogue inputs can be selected for conversion. Usually, specific µC pins in some ports are configurable as analogue inputs, or digital inputs or outputs. Converter VREF is also adjustable to adapt to analogue input span. Microcontroller peripheral can be switched ON and OFF and the conversion CLK is also adjustable. Start conversion (GO signal) triggers the acquisition and conversion complete may be detected polling the bit value DONE or alternatively, using the interrupt flag associated to such peripheral.
 |
|
Fig. 5. Typical A/D peripheral circuit embedded in a µC. |
B) Planning software
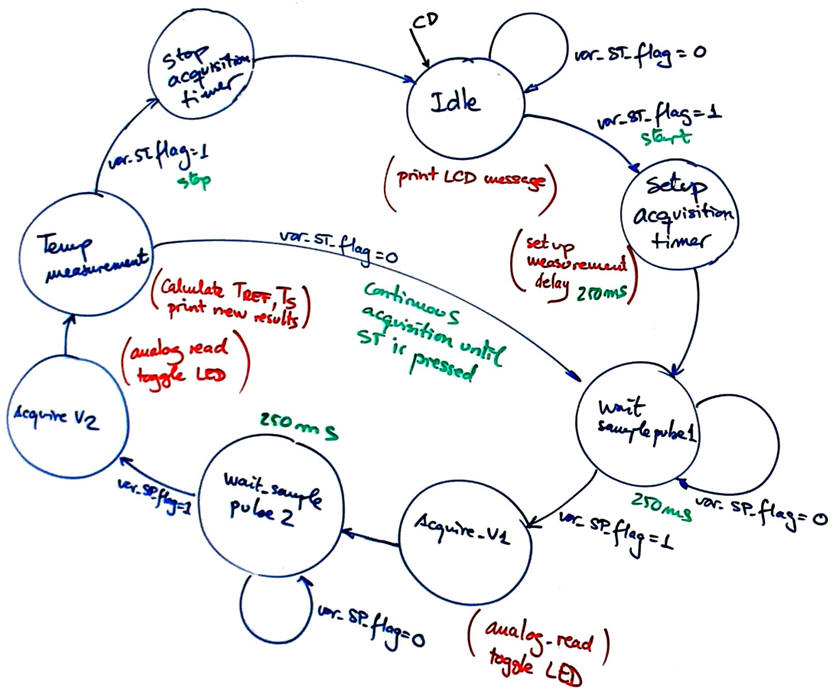
An state diagram imagining that the two voltages VR and VS are acquired periodically is presented in Fig. 4. ST flag interruption triggers the acquisition sequence an it runs until ST (stop) is pressed another time. For acquiring analogue voltages periodically we propose timing a delay equal to one half sampling period, when a time TS/2 is elapsed, var_SP_flag is set.
FSM architecture. RAM variables.
 |
|
Fig. 6. Proposed State diagram for temperature acquisition and visualisation. |
 |
|
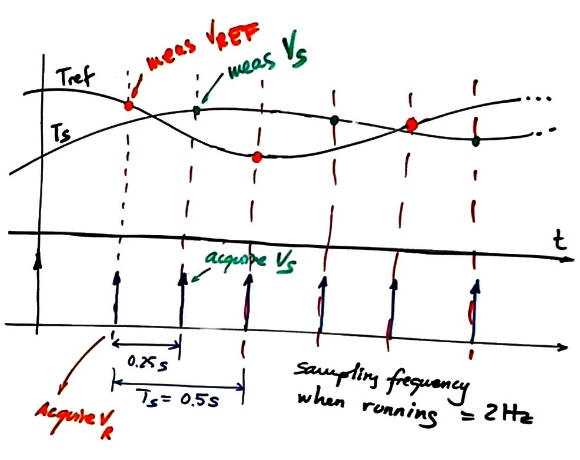
Fig. 7. When running, samples of the two voltages are taken every TS = 0.5 s. |
 |
|
Fig. 8. RAM variables. |
|
|
|
Fig. 9. Hardware and software diagram. |
Project location:
C:\CSD\P12\Temp\(files)
Target chip and tools: Arduino board.
3. Step by step developing and (4) testing
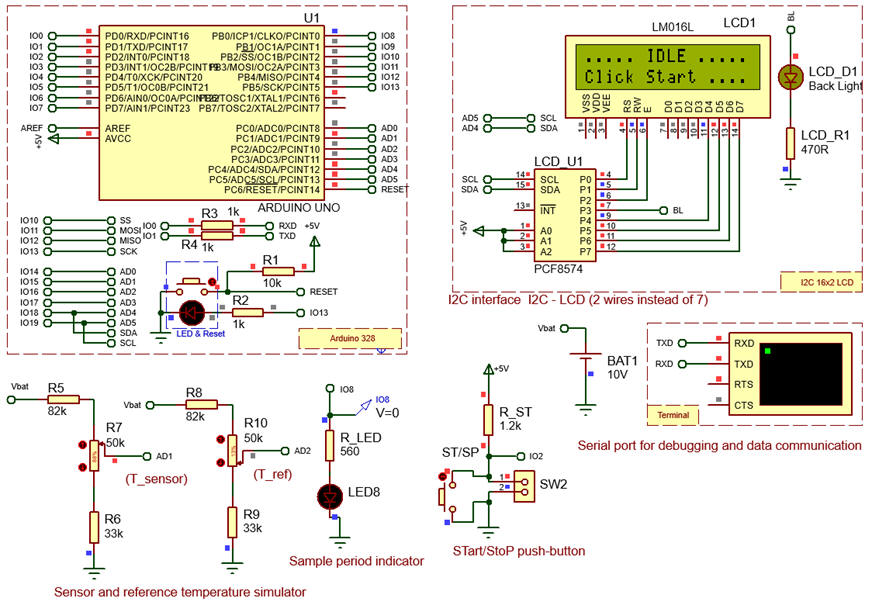
A) Developing hardware
This is an example circuit containing the hardware circuit capture and the source file "Temp_meter.zip".
B) Developing software
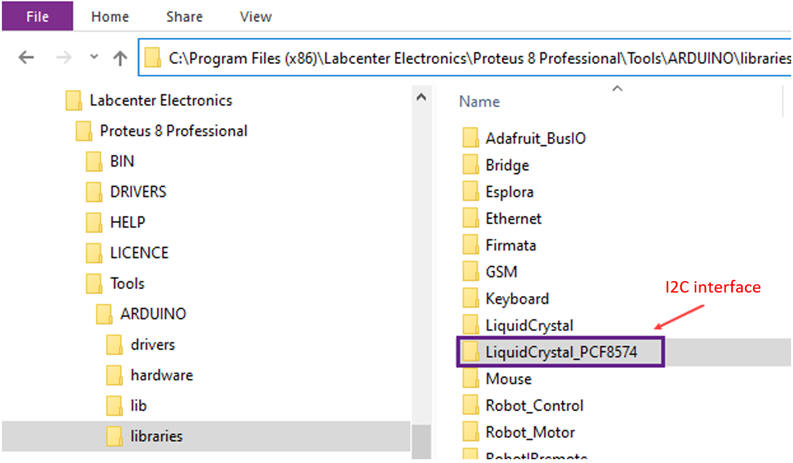
To compile this application the specific library associated to the I2C LCD display has to be as well installed in Proteus. This is the LCD library that is directly downloadable from this Github address.
 |
|
Fig. 10. Library location in the Proteus installation folder tree. |
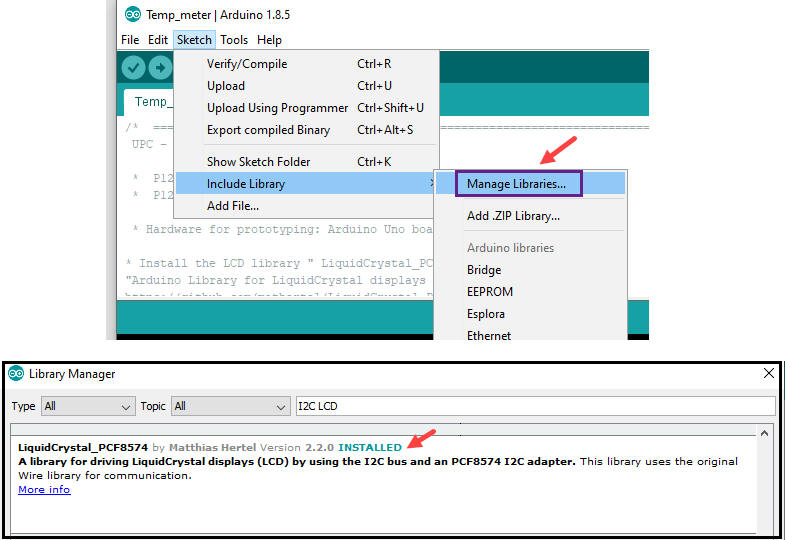
NOTE: If you run Arduino IDE alone separately from Proteus, for instance version 1.8 or 2.0, you must install the LCD I2C library clicking the top menu bar sketch:
 |
|
Fig. 11. Arduino IDE library manager. |
C) Step-by-step testing
Software compilation and Proteus simulation. Potentiometers simulate sensor outputs from 20°C to 50°C.
 |
|
Fig. 12. Proteus circuit running the application. |
5. Prototyping
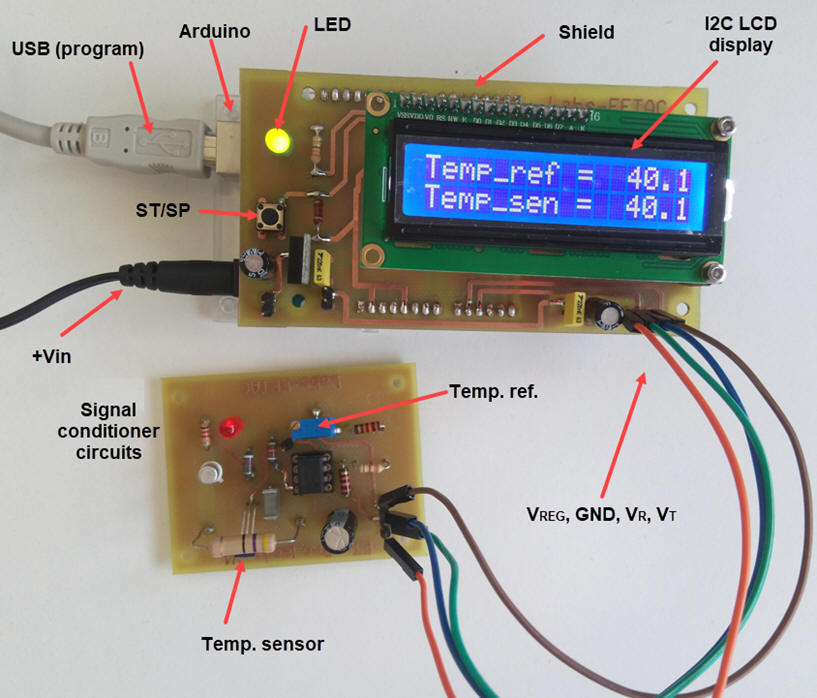
You can capture the circuit in Multisim and build a the PCB using Ultiboard, both EDA tools from National Instruments licensed to the UPC. An example prototype is pictured in Fig. 13.
Another ECAD tools for PCB design is KiCAD.
 |
|
Fig. 13. Picture of the temperature meter prototype connected to a simple temperature control system. |
5. Report
Follow this rubric for writing reports.
| Home Term 25/26-Q1 Contact Products Electronic devices and companies Software Books Magazines Instruments DEE Library EETAC DEEL |

|
|
| Web activa des de 09/2001, @ F. J. Robert, Web editat amb Microsoft Expression Web 4. El contingut és un complement als materials d'estudi del curs Circuits i Sistemes Digitals disponibles al campus digital Atenea. Llicència:Reconeixement 4.0 Internacional de Creative Commons |