|
|
Bachelor's Degree in Telecommunications Systems and in Network Engineering. Bachelor's Degree in Aerospace Systems Engineering |
|
|
Laboratory 6: Analogue inputs, electrical isolation, A/D conversion Temperature measurement system |
| 1. Specifications | Planning | Dev. & test | Prototype | Report |
We will discover and apply a new microcontroller peripheral: the analogue to digital converter (A/D). Our project goals are:
(1) Measure three analogue channels at 2 Hz sampling rate. Voltage span: VREF+ = 5 V, VREF- = 0 V. Conceive a temperature acquisition system for three analogue sensors with span from -10°C to 50°C. Temperature resolution 0.1 °C. Start/stop button. Selection of instantaneous or mean temperature values.
(2) Explain how the Arduino A/D subsystem works. Resolution, calibration curve.
(3) Discuss why analogue instrumentation and isolation amplifiers are required for some sensors and design an example of signal conditioner circuit.
Symbol, waveforms, calibration, resolution
|
|
|
Fig. 1. Symbol and connections for the temperature measurement system. |
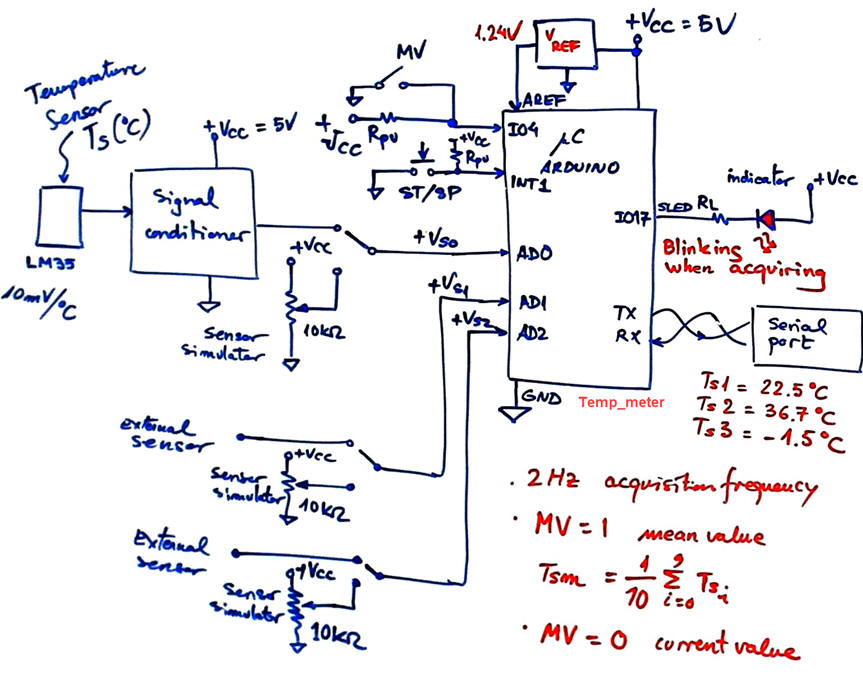
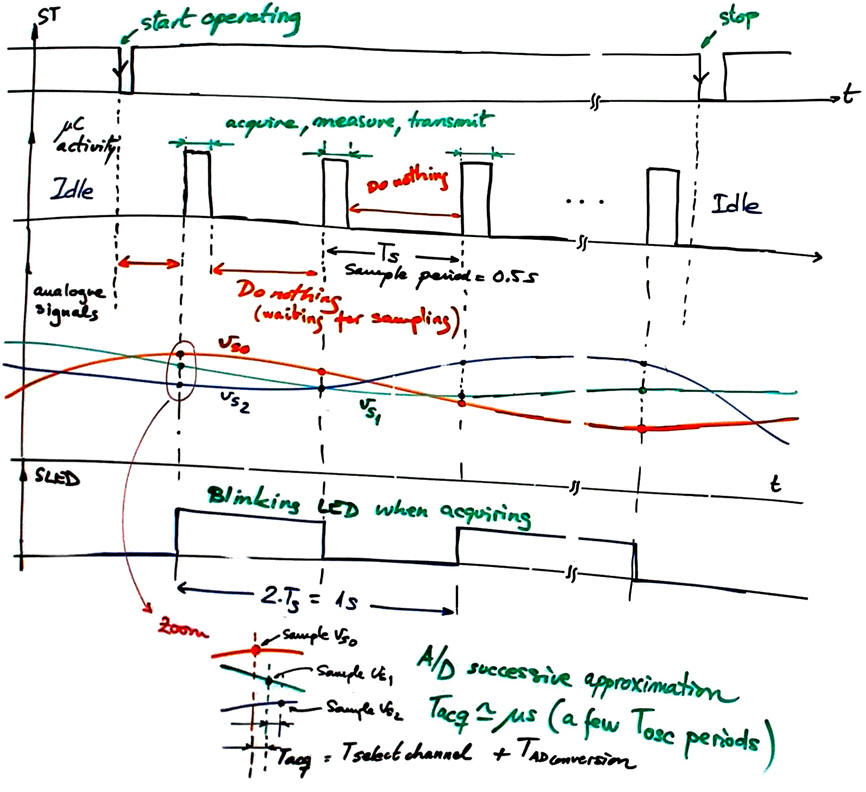
As represented in Fig. 2, after completing the acquisition/measurement/displaying cycle, the system will be idle, doing nothing, waiting for another sampling pulse. In this way, in a new version of the instrument the system can be kept sleeping for saving energy purposes (this enhancement is the purpose of LAB10).
|
|
|
|
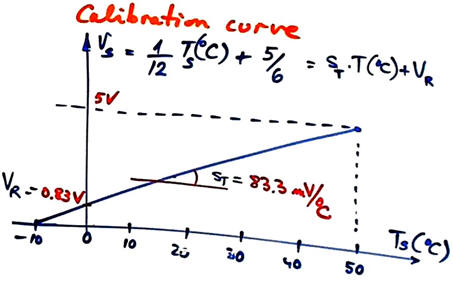
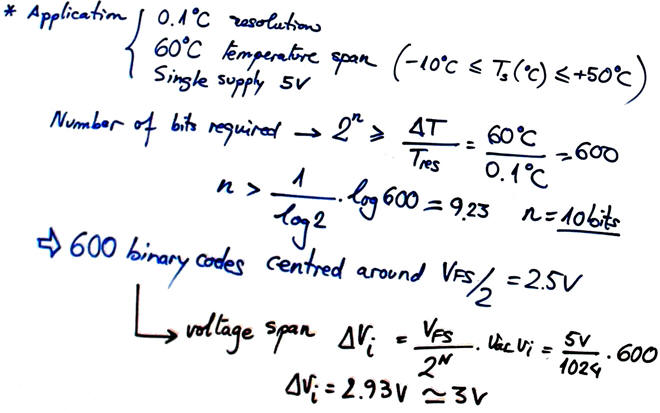
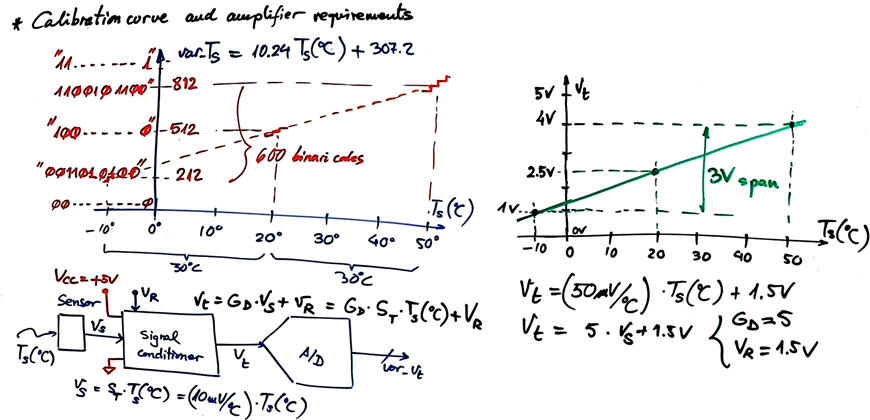
Fig. 2. Waveforms for this application. Example of calibration curve for a given temperature sensor working in the full temperature span DT = 60 °C that would cover the full scale A/D voltage span VFS = V+REF - V-REF = 5 V. A 10-bit conversion means that 1 LSB (least significant bit) = 58.6 m°C, that is far more than specified (0.1 °C). |
 |
A/D converter peripheral
Discussion on how the Arduino A/D converter peripheral works. Study the datasheet ATmega328P to analyse the converter architecture and the analogue to digital conversion technique.
|
|
|
Fig. 3. Characteristics of the A/D converter. |
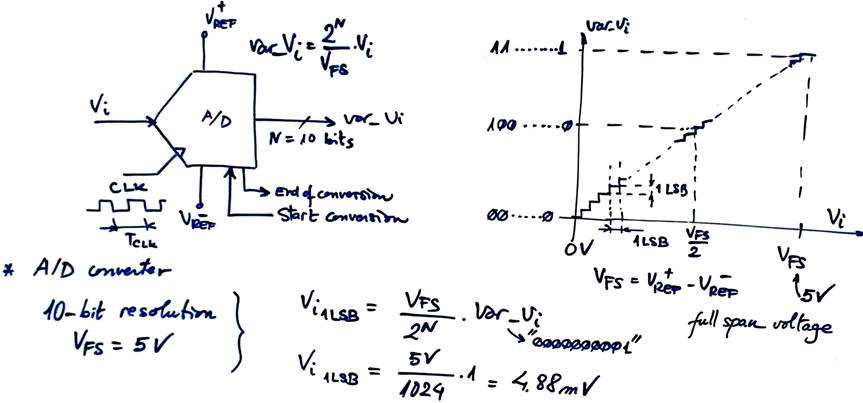
Library of Arduino functions to interface the device: analogRead(). The default full span voltage for Arduino UNO is VFS = 5 V. However, we can select another internal voltage value or external voltage such VAREF configuring the function analogReference().
Instrumentation amplifiers for signal conditioning
Conditioning sensor signals is necessary in many applications in order to interface them correctly to the mC A/D converters. They are located far away the electronic equipment, they may develop very low level signals and noise can be easily coupled to the circuit. Operational amplifiers (OA) and instrumentation amplifiers (IA) are usually used. This is a reference on many tutorials on analogue electronics.
Furthermore, in many applications galvanic or optical isolation is required as a security measure for breaking ground loops or for stepping down dangerous high voltages. Isolation amplifiers involving different technologies are required.
Find examples of physical quantities, sensors and recommended signal conditioning circuits. For instance, Fig. 4 shows how a two-OpAmp instrumentation amplifier (IA) is analysed in the tutorial from Analog Devices.
|
|
|
Fig. 4. Two OpAmp instrumentation amplifier (IA) and its ideal analysis using the superposition principle. |
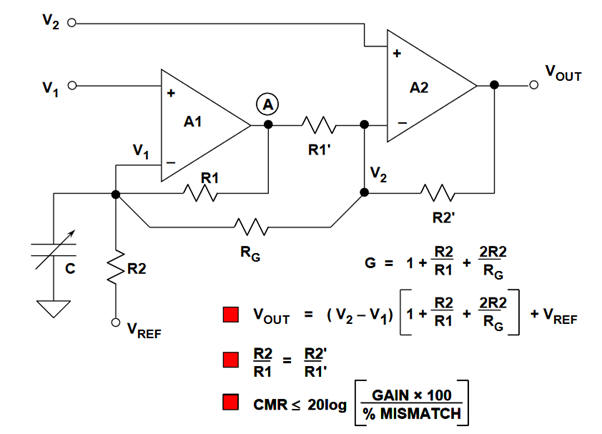
Discuss concepts such the common mode rejection ratio (CMRR), linear voltage span, maximum differential gain, symmetry, noise rejection, and OpAmps non-idealities (offset, gain, bandwidth, etc.).
How to apply IA as the signal conditioner for our single supply application? We may use rail-to-rail single supply OpAmps for instrumentation applications, such as quad LMC6484. Resistors must be 1% tolerance. References (1) (2).
Isolation amplifiers
References (1), (2). Read this TI white paper on the several techniques to transmit signals through a galvanic isolation barrier (magnetic, capacitive, optical).
|
|
|
Fig. 5a. AD203 isolation amplifier (ref.) from Analog Devices. |
|
|
|
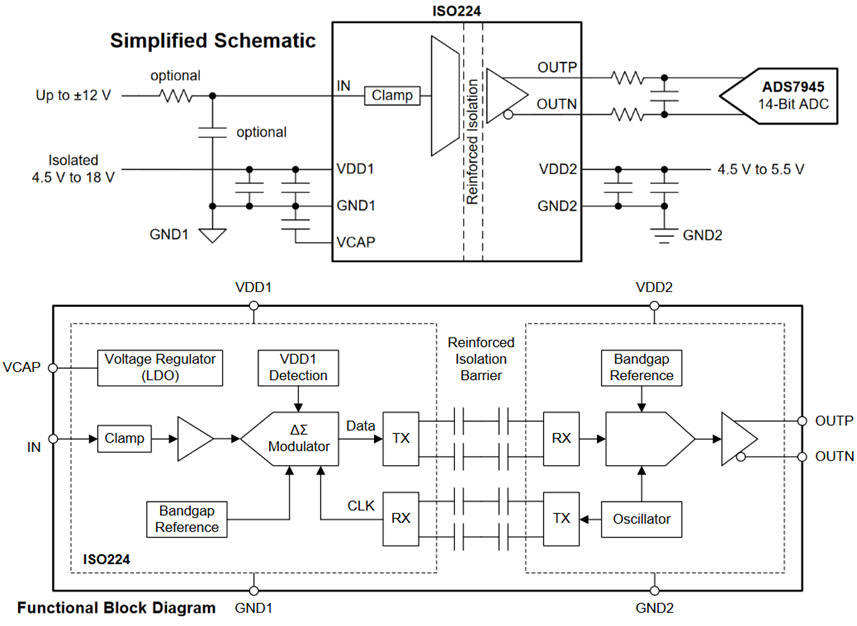
Fig. 5b. ISO224 isolation amplifier (ref.) from Texas Instruments. |
Current sensing and measurement
Some analogue sensors or actuators require current measurement instead of voltage. Find examples and discuss how currents are captured and why conditoning current has advantages over voltage when sensors are at some distance of the acquisition system.
Topics in EMC
When dealing with low level analogue signals many concepts intervene and must be analysed. For instance, galvanic or optical isolation, ground loop, noise, interference, common mode voltages and CMRR, twisted pair wiring, shielded wires, ground plane, earth connection, etc.
| Specs | 2. Planning | Dev. & test | Prototype | Report |
Hardware
As explained, not all the voltage span is necessary in our temperature meter.
|
|
|
Fig. 6. Resolution and calibration curve. |
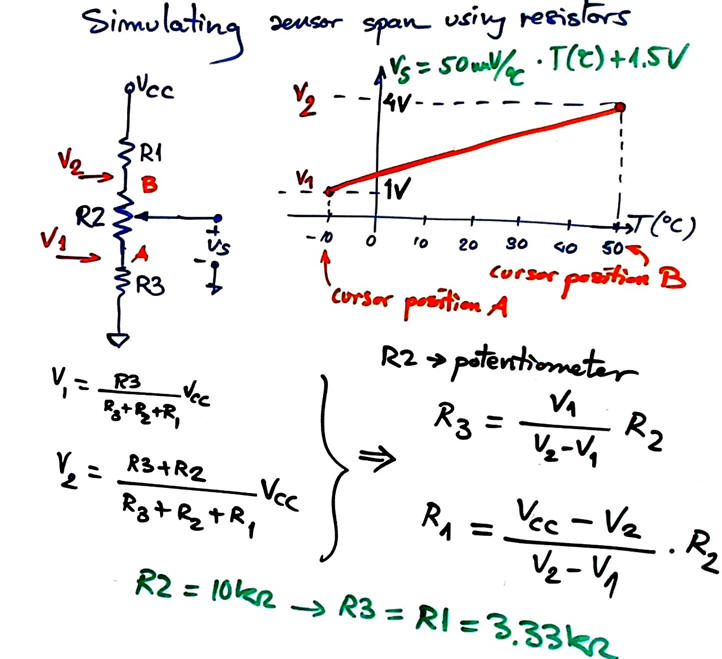
An interesting way to input signals to the analogue to digital circuit is simulation sensor voltages by means of potentiometers and voltage dividers to set a given voltage span.
|
|
|
Fig. 7. How to simulate sensor outputs using a potentiometer. |
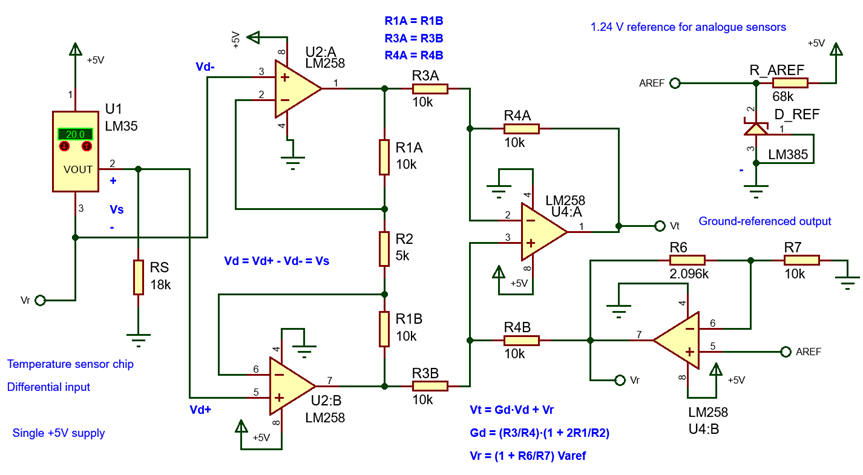
Calculating the signal conditioner for a sensor LM35 working with positive and negative temperatures. As shown in Fig. 8, we can adapt the circuits proposed in LM35 and LM385 (precision voltage reference) datasheets.
|
|
|
Fig. 8. Adjusting the instrumentation amplifier for a single power supply and a temperature resolution 0.1 °C (10 bit). |
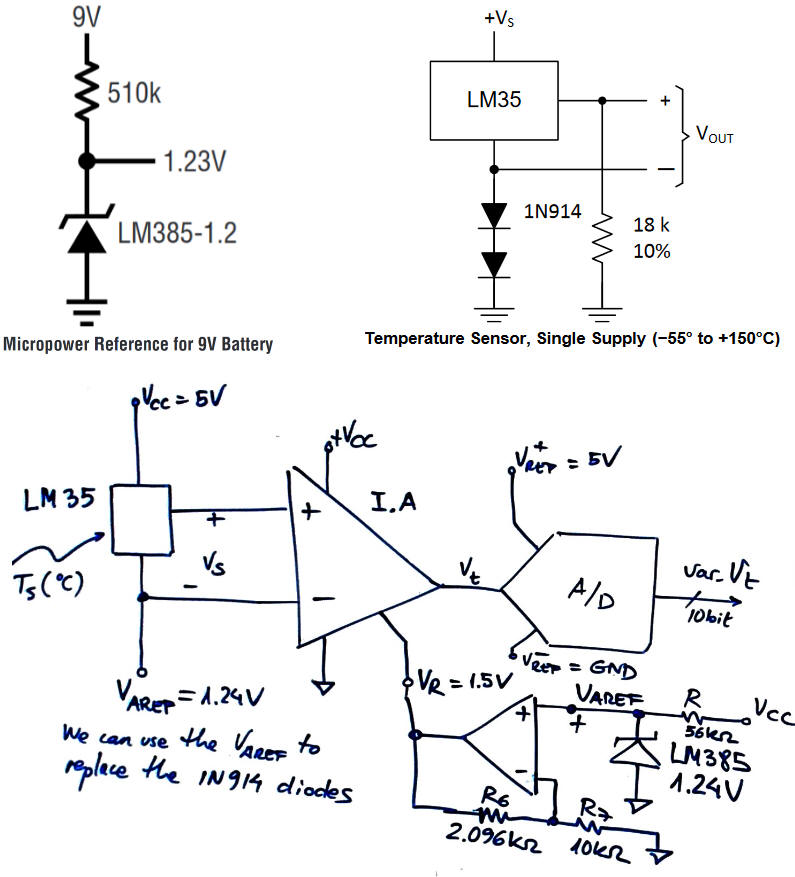
Fig 9 shows how to adjust the calibration curve to a three OpAmp IA. Calculate resistor values and simulate the circuit placing the project at:
C:\DEE\LAB6\LM35_conditioner_3OpAmp
|
|
|
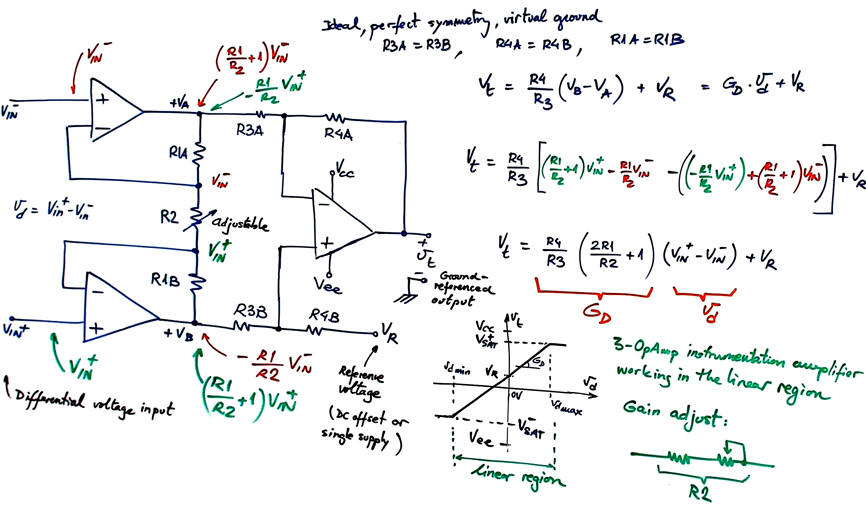
Fig. 9. Typical three OpAmp instrumentation amplifier (IA) and its ideal analysis using the superposition principle. |
Software
Conceive a FSM for acquiring, measuring and visualising results.
|
|
|
Fig. 10. Example of state diagram. Most of the time, the circuit is doing nothing, waiting for the sampling period flag to trigger acquisition. The application works continuously until ST button is clicked again. |
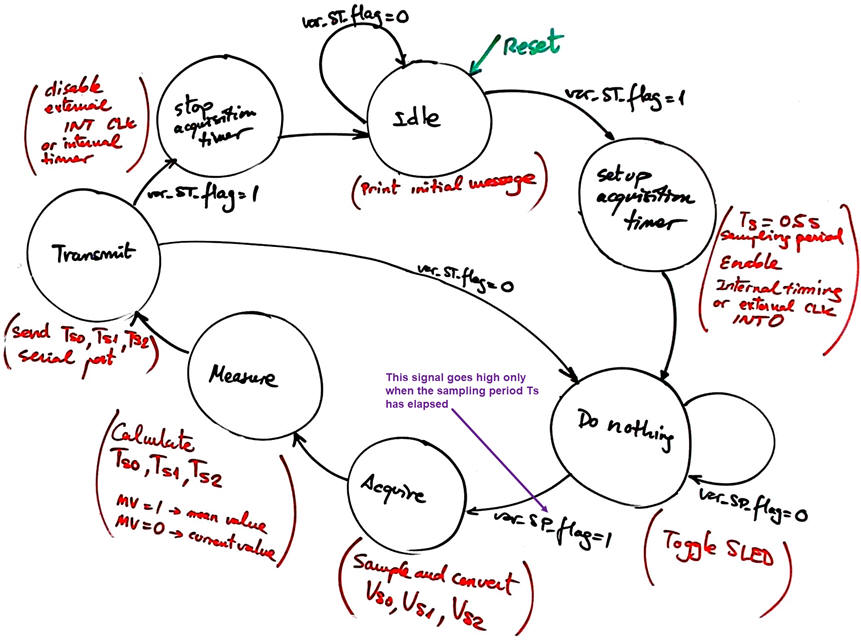
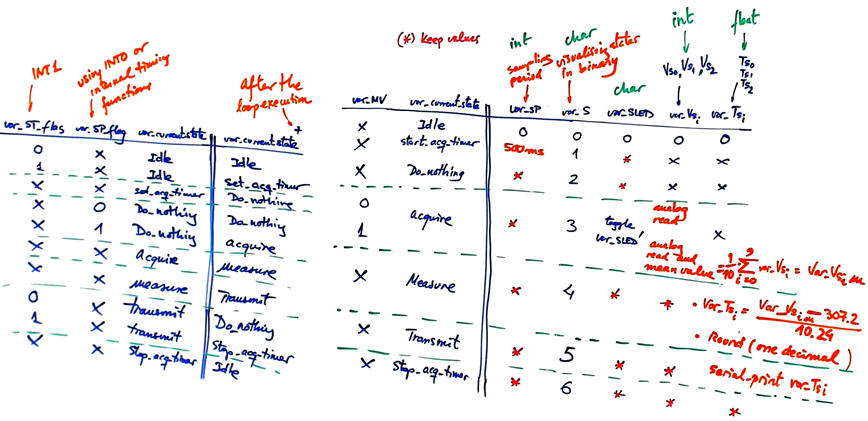
state logic() and output_logic() truth tables in Fig. 11 can be transferred to flowcharts using switch-case structure as usual.
|
|
|
Fig. 11. state_logic and output_logic() functions. |
Project location:
C:\DEE\LAB6\Temp_meter1\(design step #1 files)
C:\DEE\LAB6\Temp_meter2\( design step #2 files)
| Specs | Planning | 3. Dev. & 4. Test | Prototype | Report |
KEY idea for project implementation: add and debug hardware and software step by step: When you project reaches certain complexity, you must develop and test it in design phases and also subdivide each major design phase in several design steps. For instance:
- Prelimiary materials on organising the FSM that will control the electronic equipment:
- Switches and LED from LAB4
- Push-buttons and interrupts from LAB5
- Design phase #1: Basic temperature acquisition system as in this LAB6
- Simulate and prototype analogue subsystems such the sensor and signal conditioner
- Design step #1: Only instantaneous temperature measurements
- Design step #2: Add a new switch to select between instantaneous and mean temperature measurements
- Design phase #2: Add an LCD display as proposed in next LAB7
- Design step #1: Represent only ASCII text strings
- Design step #2: Represent also dynamic numerical data
- Design phase #3: Add analogue outputs for needle panel indicators or for generating sound waves as proposed in next LAB8
- Design phase #4: Add power drivers for high current or high voltage actuators in the next LAB9
Hardware
Analogue conditioner for the LM35 sensor
Fig. 12 is a capture of the analogue sensor conditioner (LM35_conditioner.pdsprj): three OpAmp instrumentation amplifier adjusted for a single +5 voltage supply. It is necessary to design and test this block as a fully independent subcircuit.
|
|
|
Fig. 12. Proteus circuit for simulation all the temperature span or measurement range from -10 °C to +50 °C. Sensor may be connected to voltage references VR (1.5 V) or VAREF (1.24 V). |
Analyse the voltage at each input and output and check that the OpAmps work in the linear zone (virtual ground).
Replace the OpAmp by more advanced devices, such LMC6468A, AD824P, etc.
Hardware & software
As in previous LAB4 and LAB5, when using Arduino or any other microcontroller, it is necessary to develop and test interactively both hardware and software.
Temperature acquisition system
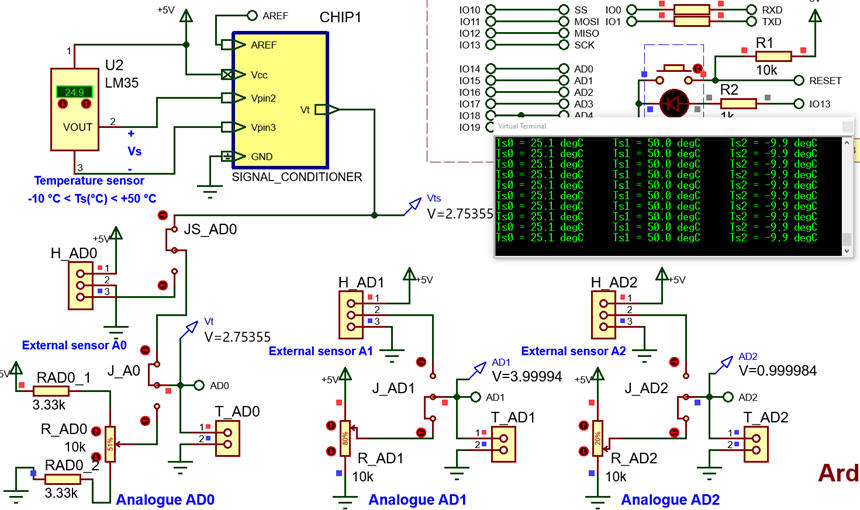
Fig. 13 shows the capture of the Arduino experimentation board (Temp_meter1.zip) (design step #1) considering up to three analogue inputs that can be simulated using potentiometers. Jumpers add flexibility selecting between external voltage sources (from sensors or signal conditioning circuits) or potentiometers. Optionally, for an easier and faster simulation, a voltage-controlled voltage source VCVS can replace the sensor conditioner design equation. The board is inherited from previous project LAB5.
|
|
|
Fig. 13. Hardware circuit to develop the project in Proteus. The analogue sensor LM35 may be connected through a header or simulated using a potentiometer. |
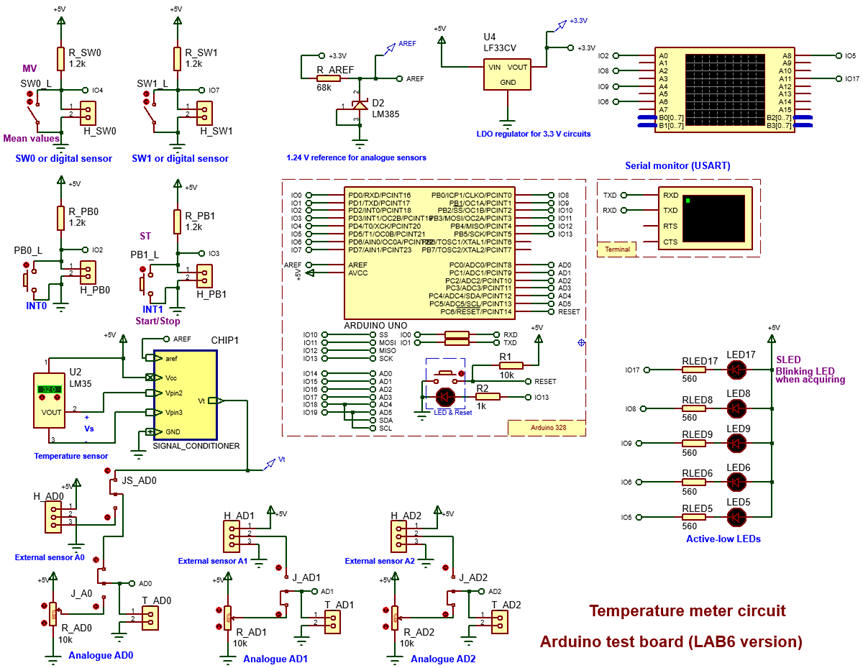
We can develop and test a first version (design step #1) where the VM switch is not used and thus only instantaneous measurements are transmitted. And later the software can be enhanced with Temp_meter2.zip (design step #2) where the VM switch at pin IO4 is read and used to select between instantaneous measurements or the mean value of the latest ten measurements.
|
|
|
Fig. 14. Circuit simulation operating. |
| Specs | Planning | Dev. & Test | 5. Prototype | Report |
PCB in KiCad
In this section we go from computer simulations to the laboratory. We can implement a PCB of the Arduino shield to check the application and perform measurements.
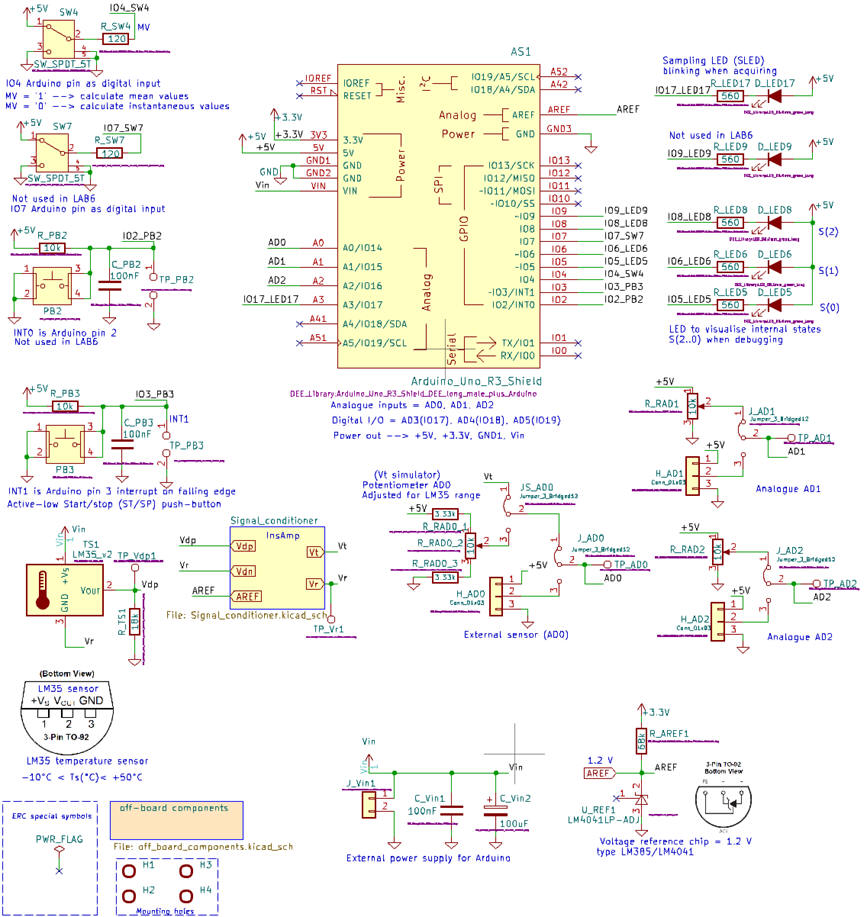
We can use the previous LAB5 template and add the new elements, basically the signal conditioner and the potenciometers for capturing analogue input voltages.We can connect as well other voltages using headers and jumpers for selecting signals. This is the PCB implementation using KiCad: LAB6_PCB_Temp_meter.zip. We can organise the full circuit in a hiearchy of several sheets.
|
|
|
Fig. 15. KiCad schematic capture. |
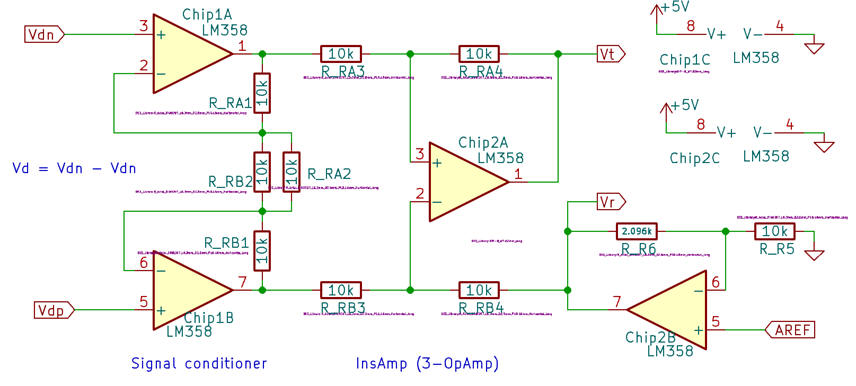
The 3-OpAmp InsAmp is captured in another sheet, as represented in in Fig. 16.
|
|
|
Fig. 16. Instrumentation amplifier for conditioning the temperature sensor signal. |
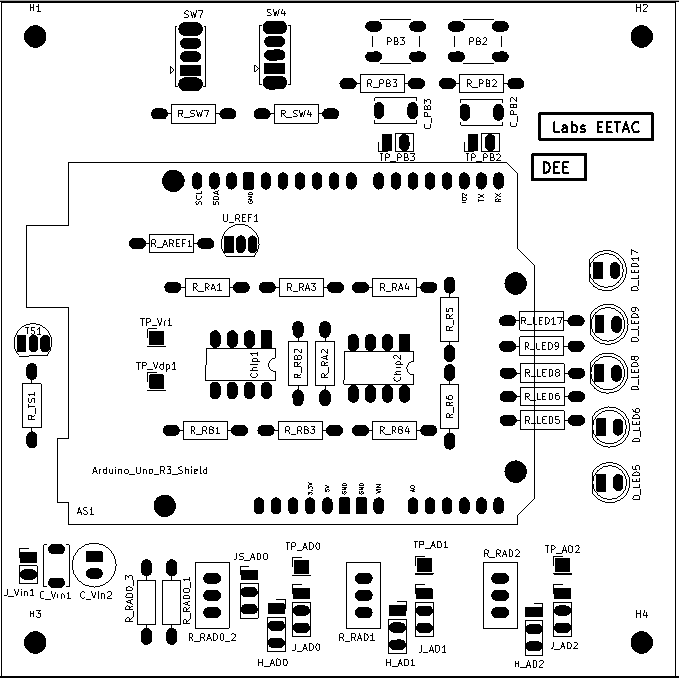
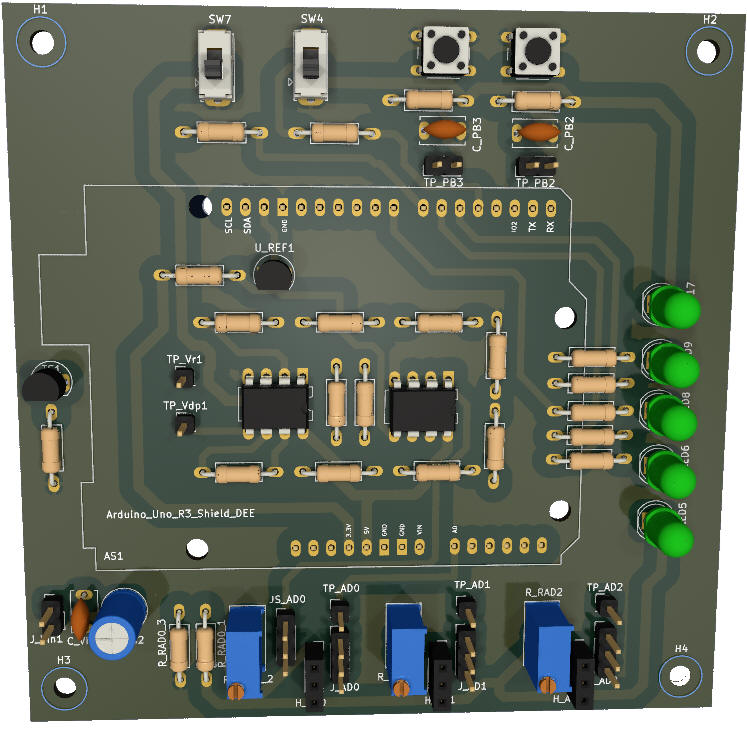
Component placement is shown in Fig. 17 in a board 10 cm x 10 cm.
|
|
|
Fig. 17. Component placement. |
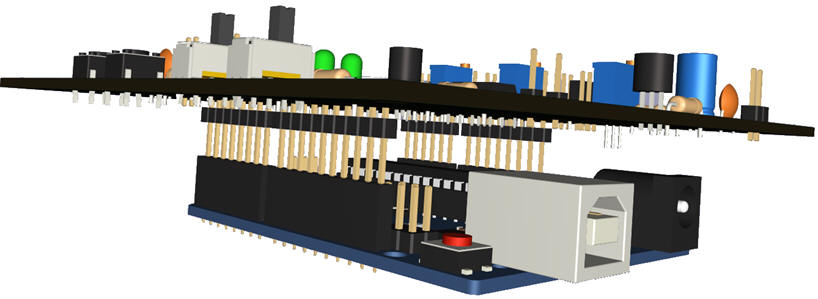
The 3D view allows us to check that all the components are in place and the final appearance of the prototype.
|
|
|
Fig. 18. 3D top view and lateral view to see show the Arduino is connected at the bottom layer using long headers (15 mm). |
NOTE: Current CSD and DEE KiCad symbols, footprints and 3D tuned components are available in these three libraries: symbols.zip, footprints.zip and 3dmodels.zip, to be unzipped and placed in the corresponding 3rdparty user directory. Basically, in this introductory level the idea behind tunnig components is to enlarge their pads for easy soldering.
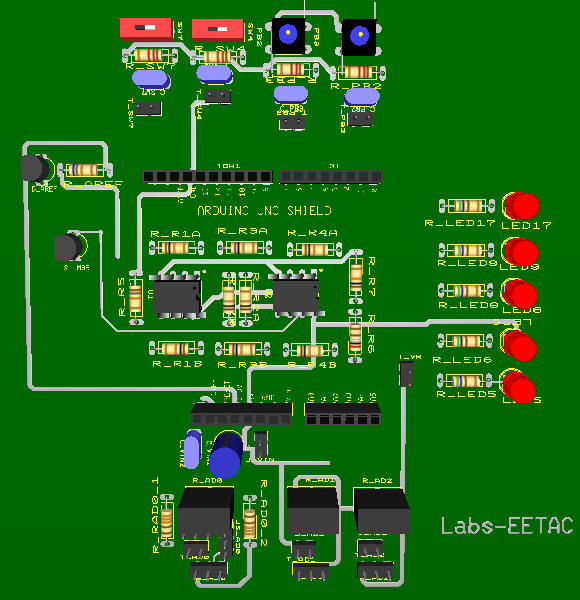
Fig. 19 shows yet another version of the PCB using Multisim-Ultiboard LAB6_PCB_v1.zip. There is always the option to optimise tracks, eliminate vias and add cooper zones.
|
|
|
Fig. 19. Example of a first version of a PCB. |
Experimentation and measurements
| Specs | Planning | Dev. & Test | Prototype | 6. Report and postlab assignments |
This web page in itself is an example of report consisting of five sections.
Additional questions:
- Measure how long does it take to acquire a temperature. What is the difference using an Arduino UNO R3 and an Arduino UNO WiFi Rev2?
- Design an alternative signal conditioner for the LM35 using the standard two OpAmp instrumentation amplifier circuit. Try as well to calibrate the same curve and use a single 5V supply voltage.
- Try to design a signal conditioner for an industrial RTD Pt100 (platinum resistance temperature detector). Temperature range: -50°C to +800°C.
- Replace the internal sampling period mechanism based on polling the function millis() by an external 2 Hz CLK signal attached at INT0 (Arduino pin 2).
| Home Contact Electronic devices and companies Books Magazines Instruments Digsys Library EETAC DEEL |

|
|
| Web activa des de 01/2023, @ F. J. Robert. Web editat amb Microsoft Expression Web 4. El contingut és material de referència per al disseny d'equips electrònics. Llicència:Reconeixement 4.0 Internacional de Creative Commons |